
If you’ve ever typed your zip code into an app the night before a storm and stared at a number like “73%,” you’ve already met snow day probability in its most popular form. But that percentage is more misunderstood than most people realize and understanding what’s actually behind it will make you far better at predicting your own snow days than any app will.
This guide breaks down what that number really represents, how a snow day calculator actually works behind the scenes, and why the same forecast can mean a guaranteed day off in one town and a completely normal school day twenty miles away.
What Is Snow Day Probability, Really?
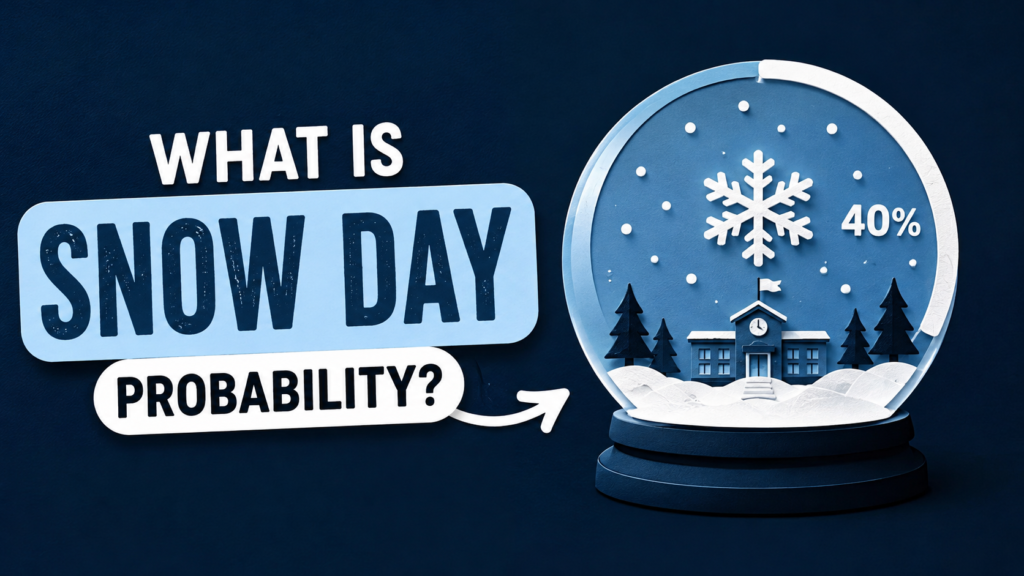
At its core, snow day probability is an estimate not a guarantee of how likely it is that your school will close due to weather. It’s built by combining forecasted snowfall, temperature, wind, and timing with historical closure patterns from your specific school district.
That last part matters more than people think. A snow day predictor isn’t just reading a weather forecast; it’s cross-referencing that forecast against how your district has behaved in similar conditions in the past. Two districts can see identical snowfall totals and end up with very different probabilities, because one has a history of cautious closures and the other rarely cancels school at all.
How the Snow Day Percentage Gets Calculated
The snow day percentage meaning behind most calculators comes down to a weighted formula, typically factoring in:
- Snowfall accumulation forecasted for the overnight and early-morning hours (this matters far more than daytime totals, since decisions are made before buses roll)
- Timing of the storm snow arriving at 5 a.m. is far more disruptive than snow that started the night before and stopped by midnight
- Temperature and ice risk, since black ice on roads often closes schools when snow alone wouldn’t
- Wind chill and visibility, which affect bus safety independent of snow depth
- Historical closure data for that specific district or county
So when you see “68% chance of a snow day,” you’re really looking at a blended estimate of forecast severity plus your district’s past behavior not a live read of an actual decision being made. No human has voted on anything yet. The snow day chance explained by these tools is a prediction, not an announcement.
Snow Day Calculator vs. Real Weather Forecasts: What’s the Difference?
A standard weather forecast tells you what the sky is going to do. A snow day calculator tries to tell you what your school is going to do and those are two very different jobs.
The weather forecast is objective: X inches of snow, Y degrees, Z% chance of precipitation. But a snow predictor takes that raw data and runs it through a subjective layer — modeling how a superintendent, transportation director, or school board typically reacts to those conditions. That’s why a snow day calc can spit out “85%” for one town and “20%” for a neighboring town under the exact same storm system.
This is also where most tools fall short. They’re good at reading weather models, but they can’t account for last-minute factors like a district’s current budget for snow removal, a recent string of “unnecessary” closures that made a superintendent gun-shy, or a single icy road that shuts down one bus route and cancels the whole day. A snow day prediction is a statistical best guess real decisions are made by real people looking at real roads at 4:30 a.m.
The Real Factors That Drive a School Closure
Behind every closure decision is a short list of practical concerns that matter more than raw snowfall totals:
- Road conditions for buses, especially on rural or hilly routes
- Time available to plow and salt before buses need to run
- Building safety parking lots, walkways, and whether heat/power is reliable
- Regional norms what’s “normal” snow for that area versus a rare event
- Neighboring district decisions, which often influence each other to avoid liability or public criticism
This is why the same six inches of snow can be a non-event in Minnesota and a full district shutdown in Georgia it’s not really about the snow. It’s about what that community is equipped to handle safely.
How to Use a Snow Day Predictor Without Getting Fooled
Apps and websites that estimate snow day probability can be a fun tool, but treating them as gospel is where people go wrong. The most common mistake is checking the percentage once, the night before, and assuming it’s locked in. In reality, snow day probability shifts constantly as new forecast data comes in a number that reads 40% at 8 p.m. can jump to 90% by midnight once an updated storm track comes through.
Here’s how to actually use one of these tools well instead of just refreshing it anxiously:
- Check it more than once. Forecast models update every few hours, and so does your percentage. A single check gives you a snapshot, not the full picture.
- Compare it against your district’s actual alert system. Most districts post closures directly to their website, an automated call system, or social media usually between 5 and 6 a.m. That source will always beat any app, because it’s the actual decision, not a prediction of one.
- Look at the trend, not just the number. A percentage that’s climbing steadily overnight is more meaningful than a single static reading.
- Don’t confuse a high percentage with a delay. Many calculators lump closures and two-hour delays into one score, so a “70%” might mean a delayed start, not a full day off.
Used this way, a predictor becomes a useful early signal rather than a source of false certainty helpful for planning your evening, but not something to bank your morning schedule on until your district actually confirms it.

Snow Day Rules in the USA, Canada, and the UK
Snow day probability doesn’t mean the same thing everywhere closure culture varies enormously by country, and that context changes how you should read any prediction.
In the United States, closures are hyper-local. Individual districts, not states, make the call, which is why probability estimates vary so much even between towns a short drive apart. Snow-belt regions like Minnesota, Michigan, and upstate New York have high thresholds and rarely close for anything under 6-8 inches, since infrastructure and driver experience are built around regular snowfall. Southern states like Georgia or Texas can shut down entirely for an inch or two, because roads, plows, and driver familiarity simply aren’t built for it.
In Canada, closures follow a similar local-decision model but tend to have a higher snow tolerance overall, especially in provinces like Alberta, Saskatchewan, and Quebec, where winter driving conditions are the norm rather than the exception. Ontario’s GTA and Atlantic Canada, which see more variable weather, are more likely to close for a single significant storm — closer to the pattern you’d see in a northern US state.
In the UK, school closures for snow are rarer and far less systematized. Because heavy snow is infrequent in most of the country, schools often lack the fleet of plows and grit trucks common in North America, so even a modest snowfall can shut things down — but there’s no widespread culture of apps or calculators built around it the way there is in the US and Canada. Closure decisions tend to be made locally by individual headteachers rather than through any predictive system.
The takeaway: a snow day probability tool built primarily on US data won’t translate well to Canadian or UK conditions without adjustment always weigh the number against your specific region’s norms, not a national average.
How to Estimate Your Own Odds (Better Than Most Apps)
The most reliable way to gauge snow day probability isn’t a fancy calculator. It’s building your own simple mental model based on your specific district’s history, which most apps simply don’t have close enough access to. Start by tracking three things over a season or two: how much snow it typically takes to close your schools, how your district has handled recent storms, and how early the decision usually comes out. Once you know your district needs roughly 4 inches overnight plus icy roads to close, you can look at any forecast and estimate your own odds far more accurately than a generic snow day predictor built for a national audience.
A few practical steps that work better than refreshing an app:
- Check the overnight forecast specifically, not just the daily total, since decisions are made before sunrise based on what’s already fallen.
- Watch for ice warnings alongside snow, since black ice closes far more schools than snow depth alone.
- Follow your district’s official alert system directly, whether that’s a text alert, robocall, or social media account. This is the actual source of truth, not a prediction of one.
- Note the time pattern. Districts that always announce by 5:30 a.m. rarely wait until 7, so if you haven’t heard anything by your district’s usual cutoff, that itself is informative.
Over time, this approach turns snow day probability from a mysterious percentage into something you can genuinely anticipate, using your own local knowledge rather than a one-size-fits-all model.
FAQs
What does snow day probability actually mean?
It’s an estimate of how likely your school is to close for weather, based on forecasted conditions combined with your district’s historical closure patterns. It’s a prediction, not a confirmed decision.
How accurate are snow day calculators?
They’re reasonably useful as an early signal, especially closer to the storm, but accuracy varies by district since local decision-makers weigh factors an app can’t fully see, like current road crew capacity or recent public criticism over past closures.
What’s a good snow day percentage to actually pay attention to?
Anything above 70 to 80 percent, especially if it’s climbing overnight, is usually worth planning around. Numbers in the 30 to 50 percent range are genuinely uncertain and shouldn’t be treated as a likely outcome either way.
Do Canada and the UK use the same snow day prediction system as the US?
Not exactly. Canadian districts follow a similar local-decision model but with generally higher snow tolerance. UK schools rarely use predictive tools at all, since closures are less frequent and typically decided school by school rather than district-wide.
Is there a way to predict snow days without an app?
Yes. Tracking your own district’s typical snowfall threshold and past closure timing, then checking the overnight forecast and ice risk directly, often gives a more accurate personal estimate than a generic calculator.