
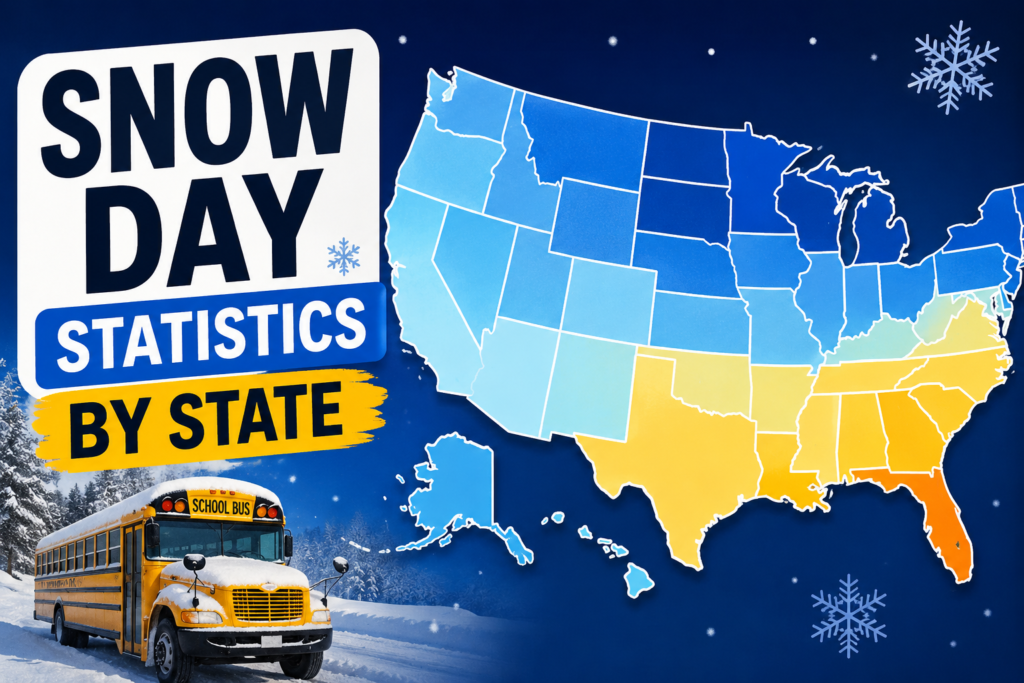
If you’ve ever wondered why a school in Georgia shuts down for an inch of snow while a district in Minnesota barely blinks at eight inches, you’re not imagining things and you’re asking the right question. Snow day statistics by state don’t follow a single national rulebook. They follow local infrastructure, local politics, and local tolerance for risk. Most articles on this topic throw a table at you and move on. This one is going to explain why the numbers look the way they do, where the data actually comes from, and how that connects to the snow day calculator and snow day predictor tools people check the night before a storm.
Why Snow Day Statistics by State Are Harder to Pin Down Than You’d Think
Here’s something most sites won’t tell you: there is no single federal agency that tracks school closures. NOAA records snowfall inches, timing, frequency but not whether a superintendent called off school because of it. That decision is made district by district, sometimes school by school, and it’s rarely reported anywhere centralized.
So when you see a site claim precise snow day statistics by state, what you’re usually looking at is an estimate built from two separate data sources stitched together: NOAA snowfall normals, and closure patterns pulled from news coverage, district calendars, or crowdsourced reports (the well-known viral snow-day map created from hundreds of self-reported answers is a good example of this method). It’s useful directionally but it’s an estimate, not an official count, and that distinction matters if you’re using it to plan around.
States With the Most School Closures Per Year
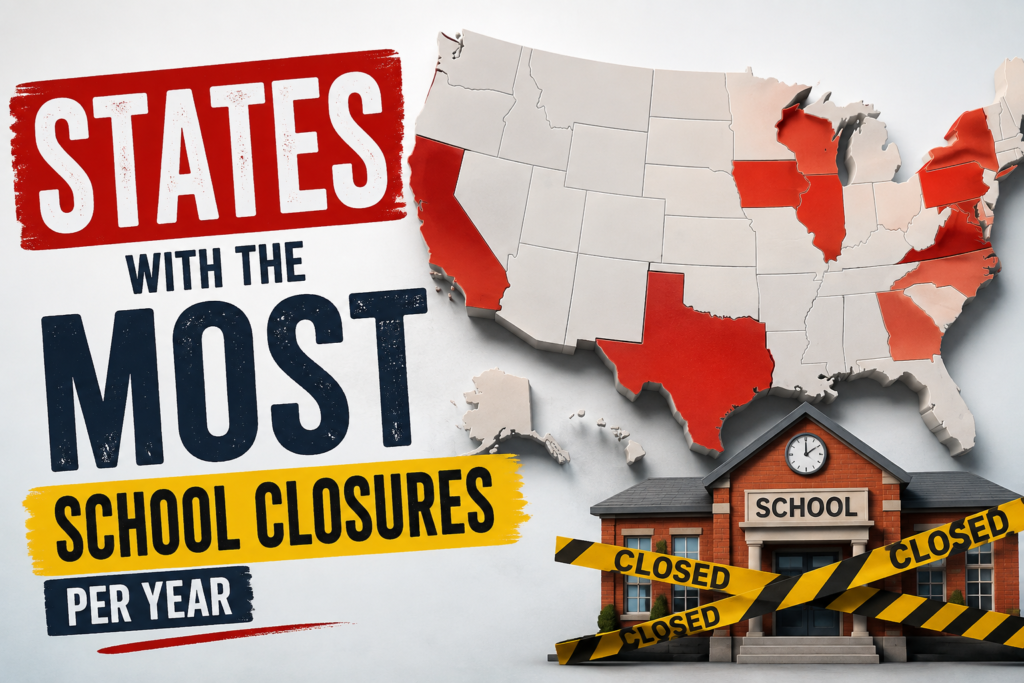
When you look at states most snow days actually report, a clear pattern shows up: it isn’t about who gets the most snow. It’s about who is least prepared to move it. Northeastern and Upper Midwest states log plenty of snowfall, but their closure counts stay comparatively low because their infrastructure is built for winter. Southern states, by contrast, see far fewer inches of snow overall, yet often rack up more closures per storm because a single event can shut down an entire region for days. This is one of the clearest patterns in snow day statistics by state: based on NOAA snowfall data combined with district-reported closure patterns, here’s how the picture typically breaks down when tracking most school closures per year:
Snowbelt States That Rarely Close (Minnesota, Vermont, Maine)
These states see dozens of snow days annually, sometimes more than 50, but schools stay open through most of it. Districts here maintain large plow fleets, pre-treat roads before storms arrive, and build bus routes around routine winter driving. A four to eight inch snowfall, which would shut down a Georgia county for a week, is often just a Tuesday in Duluth or Burlington.
Southern States That Close Fast (Georgia, Texas, Tennessee)
In these states, even half an inch of snow or a thin layer of ice can trigger a closure. It’s not overreaction. It’s math: these districts don’t own enough salt trucks or plows to justify the expense for an event that might happen once or twice a year. When snow day statistics by state get compared side by side, southern districts consistently show the highest closure rate relative to actual snowfall received.
How a Snow Day Calculator and Snow Day Predictor Use This Data
This is where state-level statistics turn into something you can actually use the night before a storm. A snow day calculator doesn’t guess randomly. It takes the same regional patterns described above (snowfall thresholds, road treatment capacity, historical closure behavior) and applies them to a specific ZIP code or district.
A good snow day predictor layers in real-time forecast data on top of those historical patterns: expected accumulation, timing relative to the morning bus window, overnight temperatures, and ice risk. That combination is why a snow predictor can show two nearby towns with very different odds for the same storm. One district might have a strong closure history at three inches, while a neighboring one rarely closes below six.
If you’re checking a snow day calc the night before, keep three things in mind:
- Timing matters more than totals. Snow that peaks after the morning bell rarely causes a closure, even if the total accumulation looks scary on paper.
- Ice changes everything. A small amount of freezing rain mixed into a forecast raises closure odds far more than an equivalent amount of plain snow.
- Check again after midnight. Storm tracks firm up overnight, so a snow day prediction checked at 11 PM is far more reliable than one checked at dinnertime.
One safety note worth repeating: these tools estimate probability, not certainty. They are not official notices. Always confirm closures through your district’s own communication channels (text alerts, robocalls, website) before making morning plans, especially around road travel.
Snow Days in Canada and the UK: How the Numbers Compare
The pattern shifts once you step outside the US. In Canada, snow day statistics by state don’t really have an equivalent, because provinces, not states, set the rules, and most provinces are built for winter from the start. Ontario and Quebec districts routinely operate through snowfalls that would close half the schools in the American South. Closures there tend to happen only during extreme events like blizzards or ice storms severe enough to threaten road safety, not routine snowfall.
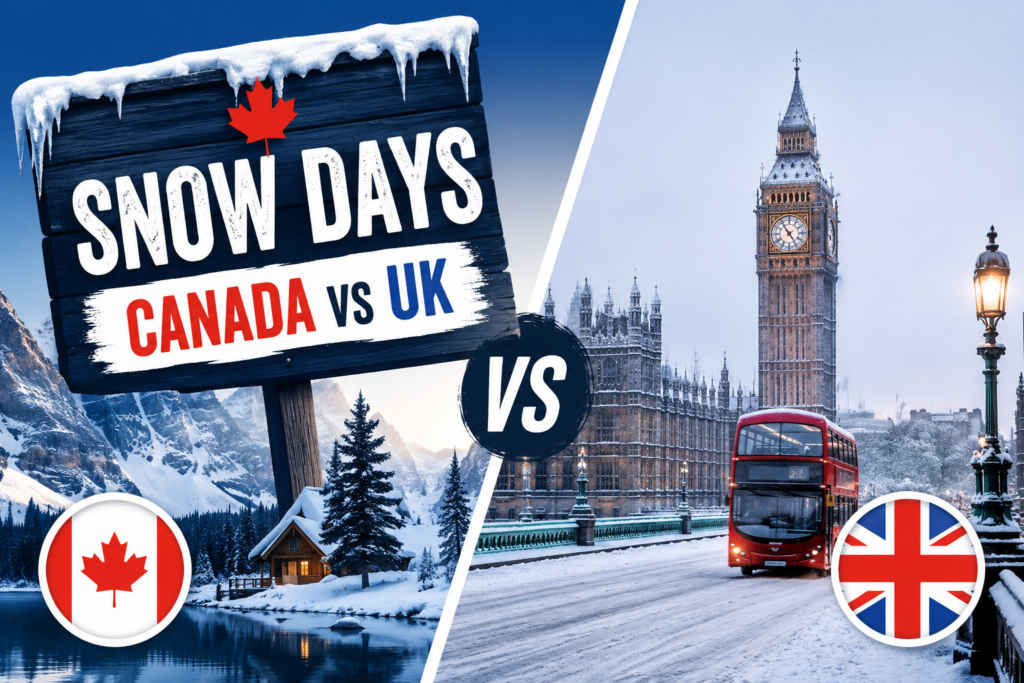
The UK sits at the opposite extreme. Snow is infrequent enough in most of the country that even a light dusting can shut schools for a day, since councils rarely invest in the plows, salt reserves, or bus fleets needed for regular snow response. A couple of inches in London can cause more disruption than a foot in Buffalo, simply because the infrastructure was never built to handle it. The takeaway is the same one that shows up again and again in the US data: closures track preparedness, not just weather.
FAQ
Do snow days get made up later in the school year?
In most US states, yes. Districts build extra instructional days into the calendar, and if too many snow days are used, the school year gets extended, or time is pulled from spring break.
Is there an official government source for snow day statistics by state?
No single federal database tracks closures directly. NOAA tracks snowfall; closure counts come from district reporting, news coverage, and crowdsourced data, which is why totals vary slightly between sources.
How accurate is a snow day predictor?
Predictors are estimates based on forecast data and historical closure patterns for your area. They’re a helpful planning tool, not an official announcement. Always confirm with your school district directly before finalizing morning plans.
Why do some states close for less snow than others?
It comes down to infrastructure and frequency, not caution. States that rarely see snow have little reason to invest in heavy winter equipment, so smaller storms cause bigger disruptions.