
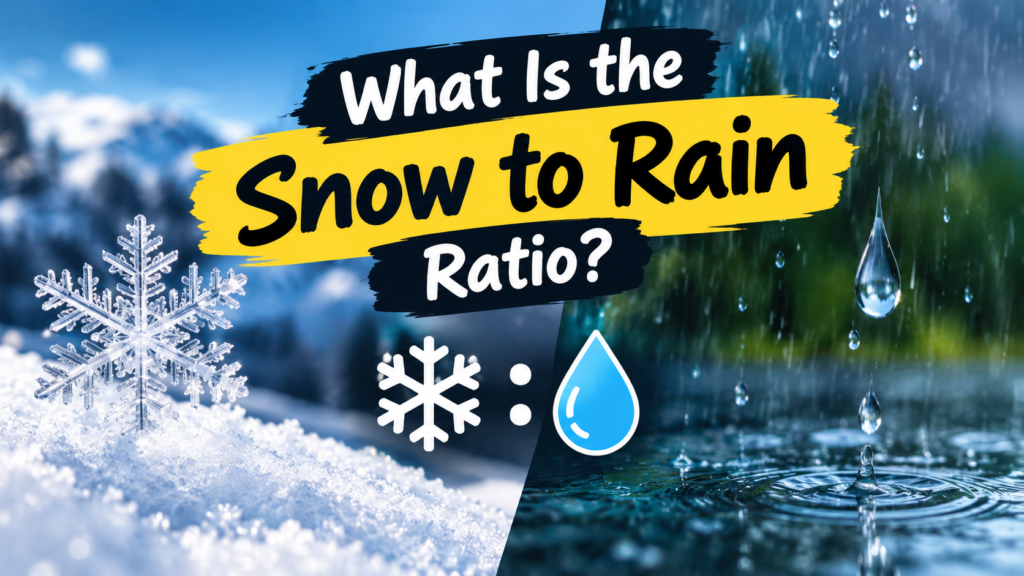
You’ve probably heard the rule: one inch of rain equals about ten inches of snow. It’s a handy shortcut, and meteorologists have used some version of it since the 1940s. But if you’ve ever watched a forecast call for “6 inches of snow” from the same storm that would’ve dropped barely half an inch of rain, you’ve already seen the rule bend.
That relationship how many inches of snow you get from a given amount of liquid precipitation is called the snow to rain ratio, sometimes labeled the snow-to-liquid ratio (SLR) in forecast discussions. It’s written as a ratio like 10:1, meaning 10 inches of snow for every 1 inch of liquid water. And while 10:1 is the number everyone learned in school, actual ratios swing far wider than that, anywhere from about 5:1 in warm, wet storms to 30:1 or higher in bitterly cold, powdery conditions.
Understanding this ratio matters for more than trivia. It’s the hidden variable behind why snow accumulation forecasts sometimes miss, why one storm buries your driveway in heavy slush while another blankets it in light fluff you can clear with a broom, and as we’ll get into later why snow day predictions aren’t as simple as “X inches expected, therefore school’s closed.”
Why the Ratio Changes: Temperature Is the Real Driver
The single biggest factor behind any snow to rain ratio is air temperature, both at the surface and in the layers of atmosphere the snow falls through. Snowflakes aren’t just frozen raindrops. They’re intricate ice crystals that grow in shape and size depending on the temperature and moisture they form in, and that shape determines how much air gets trapped between the flakes once they hit the ground.
Warmer air near freezing produces flakes that are heavier, wetter, and more tightly packed. Colder air produces flakes that are light, dry, and full of trapped air pockets, which is why they pile up so much taller for the same amount of water.
The Standard 10:1 Rule (And When It Breaks Down)
The 10:1 ratio became the go to estimate decades ago because it’s a reasonable average across a wide range of winter storms. It still works reasonably well for snow falling in the upper 20s to low 30s Fahrenheit, which describes a lot of typical snow events across the US, Canada, and the UK.
But push the temperature down toward the teens or single digits, and that same storm can easily produce a 20:1 or even 25:1 ratio. Push it up toward the freezing mark with a lot of moisture involved, and you can drop to 8:1 or lower. Meteorologists have known this for a long time, which is why modern forecast models no longer lock in on a flat 10:1 number. They estimate the ratio storm by storm based on the temperature profile through the atmosphere, not just the temperature on the ground.
Wet, Heavy Snow vs. Light, Fluffy Powder
This is where the ratio becomes something you can actually feel with a shovel. Heavy, wet snow, the kind that’s perfect for snowballs and snowmen, tends to fall in a lower ratio range, often close to 5:1 to 8:1. It’s dense, it compacts fast, and it’s noticeably harder to move.
Light, fluffy powder sits at the other end, often 20:1 to 30:1 or higher in extreme cold. It looks impressive piled up on a windowsill, but it contains far less actual water than its depth suggests, and a stiff wind can blow it right off the driveway you just cleared.
How Snow Accumulation Is Measured on the Ground
Knowing the ratio is only half the picture. The other half is how snow accumulation is measured once it actually falls, and this part surprises a lot of people.
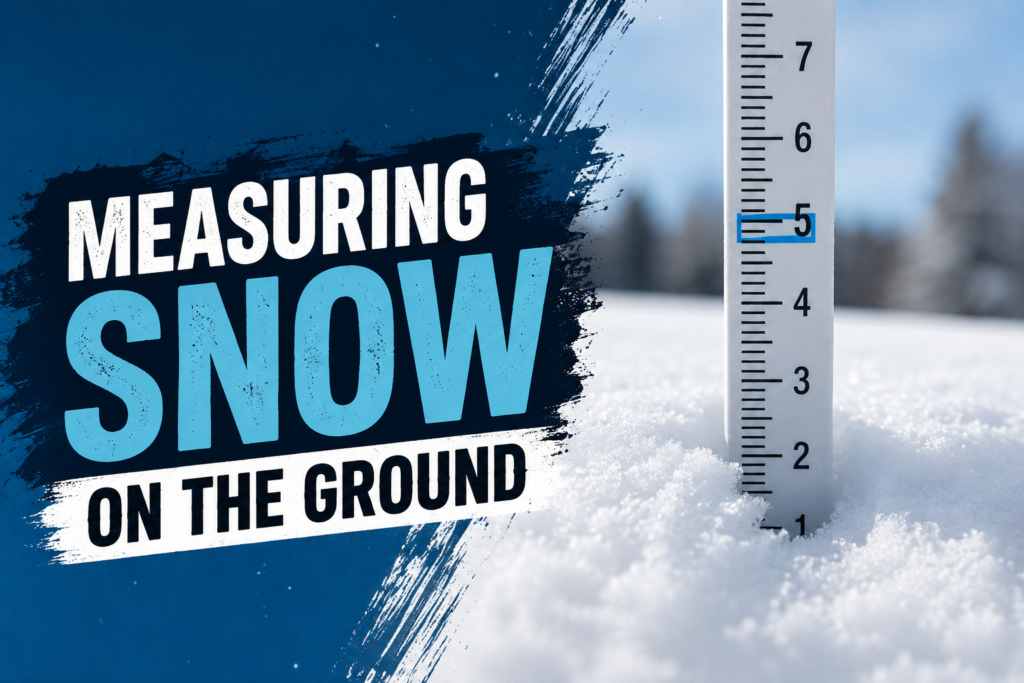
Official measurements, whether from the National Weather Service in the US, Environment Canada, or the UK Met Office, aren’t taken by just sticking a ruler into a snowbank once. Observers use a snow board, a flat white surface set out before the storm begins, and measure the depth on it every six hours, then clear it off and start fresh. That six hour reset matters because snow settles and compacts under its own weight over time. Without resetting the board, a storm’s total would come out lower than what actually fell, since the earliest snow gets compressed by everything on top of it.
This is also where the snow to rain ratio gets used in reverse. To find the true liquid equivalent of a storm, observers melt a sample of the snow and measure the water left behind. That measurement is what actually feeds into seasonal precipitation totals and drought tracking, not the snow depth itself. So when you hear a storm produced “1.2 inches of liquid equivalent,” that number came from melting snow, not from rainfall at all.
For everyday readers, the practical takeaway is simple: a forecast that predicts inches of snow is really predicting inches of liquid multiplied by an estimated ratio. If that ratio estimate is off, even a well forecast storm can produce a noticeably different snow total than expected.
How the Snow to Rain Ratio Affects Snow Day Predictions
This is where the ratio stops being a weather trivia fact and starts mattering to your actual week. Every snow day predictor or snow day calculator you’ll find online is, underneath the hood, working from the same basic inputs a meteorologist uses: expected liquid precipitation, temperature, timing, and wind. The snow to rain ratio is baked into that math, because it’s what turns “half an inch of liquid” into either a dusting or eight inches of snow.
This is also a big reason snow day prediction can miss even when the forecast itself was solid. A model might correctly predict the amount of moisture moving through, but if the atmosphere ends up a few degrees colder or warmer than expected at the surface, the ratio shifts, and so does the final snow total. A storm forecast for 4 inches at a 10:1 ratio can turn into 7 or 8 inches if temperatures drop faster than expected and the ratio climbs to 18:1 or 20:1 instead. That swing is often enough to push a district from a two hour delay to a full closure, or the other way around.
FAQs
What is a normal snow to rain ratio?
The most commonly cited average is 10:1, meaning 10 inches of snow for every 1 inch of liquid precipitation. In practice, most storms fall somewhere between 8:1 and 15:1 depending on temperature.
Why do meteorologists say 13:1 instead of 10:1?
Some regions and agencies use a slightly higher average, like 13:1, based on long term climate data for that area. It’s still an average, and actual storms will land above or below it depending on conditions.
How does temperature affect the snow to rain ratio?
Colder air produces lighter, drier flakes with more trapped air, pushing the ratio higher (20:1 or more). Warmer air near freezing produces denser, wetter flakes, pushing the ratio lower (around 5:1 to 8:1).
How is snow accumulation measured officially?
Official snow accumulation is measured using a snow board that gets cleared and remeasured every six hours during a storm, then the readings are added together. This prevents settling and compaction from making the total look smaller than what actually fell.
Can a snow day predictor be wrong because of the ratio?
Yes. A snow day predictor relies on an estimated ratio to convert forecast moisture into a snow total. If the actual temperature profile during the storm differs from what was expected, the ratio shifts and the predicted snowfall total can end up higher or lower than forecast.